Robust inference of time-courses using mixtures of Hidden Markov Models: Supplemental Material
Alexander , Christine Steinhoff, Alexander Schönhuth
GQL
The GQL-software, licensed under the GPL, is available at http://ghmm.org/gql. It requires a couple of other packages, most importantly Python and the GHMM.
Simulated Data
The simulated data simulated.txt.gz contains in a tab-seperated ASCII-file the following data
- Column 1: An ID ranging from 1-3500
- Column 2: A class ID ranging from 1-6 and corresponding to C1-C6 in the description of the simulated data
- Column 3-32: The simulated expression values at the varying time points
If a header line of the form "Gene name Accession t1 t2 ..." is prepended the file can be read by Caged.
Results: Whitfield Data
The detailed annotation for clusters shown in Fig. 2 in the paper. The clone ID of time-courses used as labeled data in the partially supervised context are displayed in bold face (all browsers) and with a light-grey background (Internet Explorer does).
| CLONEID | ACC | LLID | Phase | Our ID | Cluster |
| IMAGE:898286 | AA598974 | G2 | 5 | (a) phase 1 | |
| IMAGE:66406 | T66936 | 55355 | G2 | 12 | (a) phase 1 |
| IMAGE:712505 | AA278152 | G2 | 25 | (a) phase 1 | |
| IMAGE:1540236 | AA936181 | 55355 | G2 | 56 | (a) phase 1 |
| IMAGE:1536451 | AA919126 | G2 | 83 | (a) phase 1 | |
| IMAGE:460438 | AA677552 | 55247 | G2 | 108 | (a) phase 1 |
| IMAGE:769921 | AA430504 | 11065 | G2 | 3 | (a) phase 1 |
| IMAGE:825470 | AA504348 | 7153 | G2 | 6 | (a) phase 1 |
| IMAGE:366971 | AA026682 | 7153 | G2 | 8 | (a) phase 1 |
| IMAGE:292936 | N63744 | 55143 | G2 | 10 | (a) phase 1 |
| IMAGE:455128 | AA676797 | 899 | G2 | 11 | (a) phase 1 |
| IMAGE:301388 | N79504 | G2 | 16 | (a) phase 1 | |
| IMAGE:146882 | R80990 | 11065 | G2 | 22 | (a) phase 1 |
| IMAGE:131316 | R22949 | G2 | 27 | (a) phase 1 | |
| IMAGE:246808 | N53214 | 55655 | G2 | 28 | (a) phase 1 |
| IMAGE:200402 | R96998 | 81610 | G2 | 38 | (a) phase 1 |
| IMAGE:281898 | N53308 | 1163 | G2 | 59 | (a) phase 1 |
| IMAGE:1035796 | AA628867 | G2 | 63 | (a) phase 1 | |
| 12192535 | AA719022 | 84914 | G2 | 70 | (a) phase 1 |
| IMAGE:703633 | AA278629 | 1163 | G2 | 79 | (a) phase 1 |
| IMAGE:824913 | AA489023 | G2 | 80 | (a) phase 1 | |
| IMAGE:1694526 | AI124082 | 55771 | G2 | 90 | (a) phase 1 |
| IMAGE:129961 | R19267 | 3833 | G2 | 97 | (a) phase 1 |
| IMAGE:430973 | AA678348 | G2 | 99 | (a) phase 1 | |
| IMAGE:1456207 | AI791356 | 51343 | G2 | 101 | (a) phase 1 |
| IMAGE:30170 | R42530 | 836 | G2 | 105 | (a) phase 1 |
| IMAGE:2062329 | AI337292 | 7272 | G2/M | 62 | (a) phase 1 |
| IMAGE:882510 | AA676460 | 3838 | G2 | 9 | (a) phase 2 |
| IMAGE:788256 | AA454098 | 9493 | G2 | 23 | (a) phase 2 |
| IMAGE:951241 | AA620485 | 51203 | G2 | 34 | (a) phase 2 |
| IMAGE:825606 | AA504719 | 3832 | G2 | 36 | (a) phase 2 |
| IMAGE:810209 | AA464521 | 89987 | G2 | 40 | (a) phase 2 |
| IMAGE:824962 | AA489087 | 3838 | G2 | 43 | (a) phase 2 |
| IMAGE:71902 | T52152 | 26586 | G2 | 57 | (a) phase 2 |
| IMAGE:461933 | AA779949 | 51203 | G2 | 71 | (a) phase 2 |
| IMAGE:42831 | R60197 | G2 | 81 | (a) phase 2 | |
| IMAGE:1486028 | AA912032 | G2 | 94 | (a) phase 2 | |
| IMAGE:950690 | AA608568 | 890 | G2 | 2276 | (a) phase 2 |
| IMAGE:725454 | AA292964 | 1164 | G2/M | 13 | (a) phase 2 |
| IMAGE:129865 | R19158 | G2/M | 1 | (a) phase 2 | |
| IMAGE:727526 | AA411850 | 1062 | G2/M | 7 | (a) phase 2 |
| IMAGE:209066 | H63492 | 8465 | G2/M | 20 | (a) phase 2 |
| IMAGE:435076 | AA701455 | 1063 | G2/M | 24 | (a) phase 2 |
| IMAGE:115443 | T87442 | 51530 | G2/M | 29 | (a) phase 2 |
| IMAGE:194656 | R84407 | G2/M | 33 | (a) phase 2 | |
| IMAGE:2017415 | AI369629 | 1058 | G2/M | 37 | (a) phase 2 |
| IMAGE:795936 | AA460927 | 7247 | G2/M | 42 | (a) phase 2 |
| IMAGE:705064 | AA279990 | 10460 | G2/M | 48 | (a) phase 2 |
| IMAGE:243135 | H95819 | G2/M | 67 | (a) phase 2 | |
| IMAGE:743810 | AA634371 | 83461 | G2/M | 74 | (a) phase 2 |
| IMAGE:431242 | AA682533 | G2/M | 86 | (a) phase 2 | |
| IMAGE:814995 | AA465090 | G2/M | 87 | (a) phase 2 | |
| IMAGE:590253 | AA147792 | 55632 | G2/M | 91 | (a) phase 2 |
| IMAGE:2327739 | AI693023 | 51203 | G2/M | 100 | (a) phase 2 |
| IMAGE:825228 | AA504389 | 26586 | G2/M | 104 | (a) phase 2 |
| IMAGE:264502 | N20305 | G2/M | 121 | (a) phase 2 | |
| IMAGE:234045 | H66982 | 55632 | G2/M | 165 | (a) phase 2 |
| IMAGE:213824 | H72444 | G1/S | 35 | (a) phase 3 | |
| IMAGE:744047 | AA629262 | 5347 | G2/M | 2 | (a) phase 3 |
| IMAGE:590774 | AA158169 | 5603 | G2/M | 4 | (a) phase 3 |
| IMAGE:232837 | H73968 | 22974 | G2/M | 14 | (a) phase 3 |
| IMAGE:781047 | AA446462 | 699 | G2/M | 15 | (a) phase 3 |
| IMAGE:359119 | AA010065 | 1164 | G2/M | 17 | (a) phase 3 |
| IMAGE:610362 | AA171715 | G2/M | 26 | (a) phase 3 | |
| IMAGE:759873 | AA423944 | 10234 | G2/M | 30 | (a) phase 3 |
| IMAGE:898062 | AA598776 | 991 | G2/M | 31 | (a) phase 3 |
| IMAGE:645565 | AA204830 | G2/M | 45 | (a) phase 3 | |
| IMAGE:2019372 | AI369284 | 51512 | G2/M | 46 | (a) phase 3 |
| IMAGE:1540227 | AA936183 | 22974 | G2/M | 47 | (a) phase 3 |
| IMAGE:842968 | AA488324 | 701 | G2/M | 50 | (a) phase 3 |
| IMAGE:128711 | R12261 | 54443 | G2/M | 52 | (a) phase 3 |
| IMAGE:853066 | AA668256 | 9918 | G2/M | 54 | (a) phase 3 |
| IMAGE:429323 | AA007395 | 127 | G2/M | 72 | (a) phase 3 |
| IMAGE:435334 | AA699928 | G2/M | 85 | (a) phase 3 | |
| IMAGE:48398 | H14392 | 994 | G2/M | 89 | (a) phase 3 |
| IMAGE:50787 | H16833 | 6715 | G2/M | 96 | (a) phase 3 |
| IMAGE:2308994 | AI654707 | 22974 | G2/M | 127 | (a) phase 3 |
| IMAGE:50615 | H17513 | 3305 | G2/M | 140 | (a) phase 3 |
| IMAGE:51532 | H20558 | 23204 | G2/M | 18 | (a) phase 3 |
| IMAGE:511096 | AA088458 | G2/M | 51 | (a) phase 3 | |
| IMAGE:796694 | AA460685 | 332 | G2/M | 53 | (a) phase 3 |
| IMAGE:415089 | W93379 | 4751 | G2/M | 60 | (a) phase 3 |
| IMAGE:510228 | AA053556 | 4288 | G2/M | 61 | (a) phase 3 |
| IMAGE:511786 | AI732412 | 10595 | G2/M | 76 | (a) phase 3 |
| IMAGE:511967 | AI732416 | 10595 | G2/M | 92 | (a) phase 3 |
| IMAGE:1646048 | AI031571 | 55710 | G2/M | 110 | (a) phase 3 |
| IMAGE:121857 | T97349 | 10615 | G2/M | 125 | (a) phase 3 |
| IMAGE:2307015 | AI652290 | 10615 | G2/M | 154 | (a) phase 3 |
| IMAGE:856289 | AA774665 | 9133 | G2/M | 2275 | (a) phase 3 |
| IMAGE:810600 | AA464019 | 27338 | M/G1 | 21 | (a) phase 3 |
| IMAGE:209383 | H64096 | 3312 | M/G1 | 181 | (a) phase 3 |
| IMAGE:531402 | AA075920 | 4174 | G1/S | 78 | (b) |
| IMAGE:68950 | T54121 | 898 | G1/S | 32 | (b) |
| IMAGE:126650 | R06944 | 51514 | G1/S | 19 | (b) |
| IMAGE:565734 | AA135809 | G1/S | 41 | (b) | |
| IMAGE:236142 | H61303 | G1/S | 49 | (b) | |
| IMAGE:418150 | W90164 | 51514 | G1/S | 58 | (b) |
| IMAGE:789182 | AA450264 | 5111 | G1/S | 77 | (b) |
| IMAGE:704410 | AA279658 | G1/S | 158 | (b) | |
| IMAGE:43229 | H13004 | 5111 | G1/S | 2273 | (b) |
| IMAGE:204214 | H59203 | 990 | G1/S | 39 | (b) |
| IMAGE:280375 | N47113 | 29028 | G1/S | 109 | (b) |
| IMAGE:1475463 | AA857804 | 63967 | G1/S | 130 | (b) |
| IMAGE:297178 | W03979 | 79733 | S phase | 69 | (b) |
| IMAGE:1579997 | AA934904 | 79075 | S phase | 139 | (b) |
The following Figures display the time-courses found: Fig. 1 depicts all time-course in cluster (a) and the result of the Viterbi-decomposition into phases 1-3 (see Fig. 2-4). The last figure shows cluster (b).
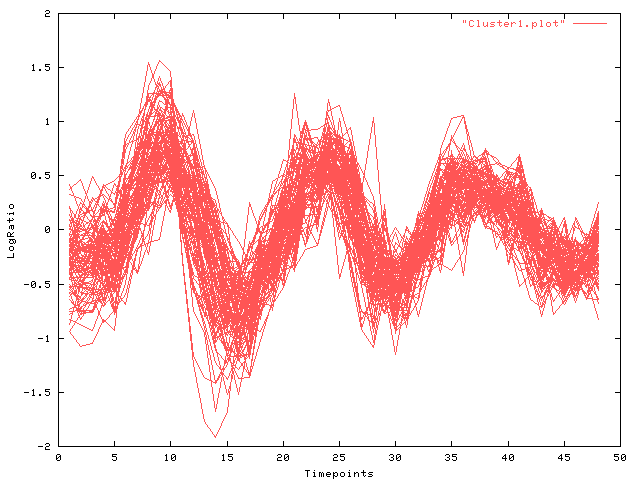 |
| Fig. 1 Log-ratio (y-axis) over time (x-axis): cluster (a) all phases |
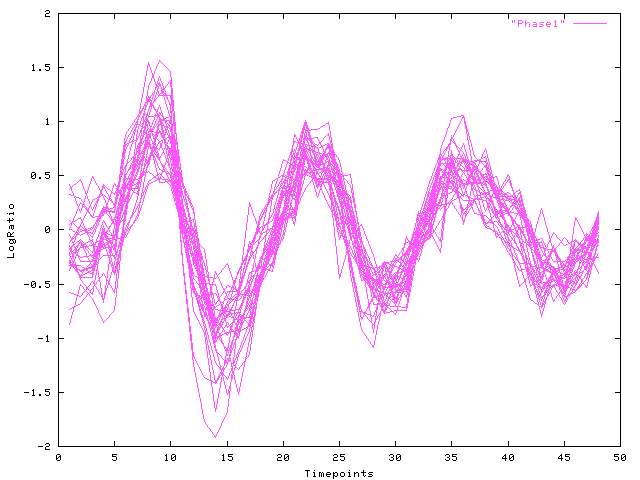 |
| Fig. 2 Log-ratio (y-axis) over time (x-axis): Viterbi decomposition of cluster (a), phase 1 |
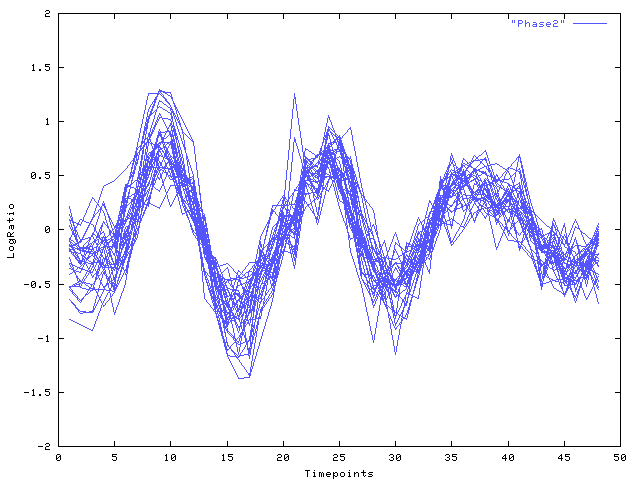 |
| Fig. 3 Log-ratio (y-axis) over time (x-axis): Viterbi decomposition of cluster (a), phase 2 |
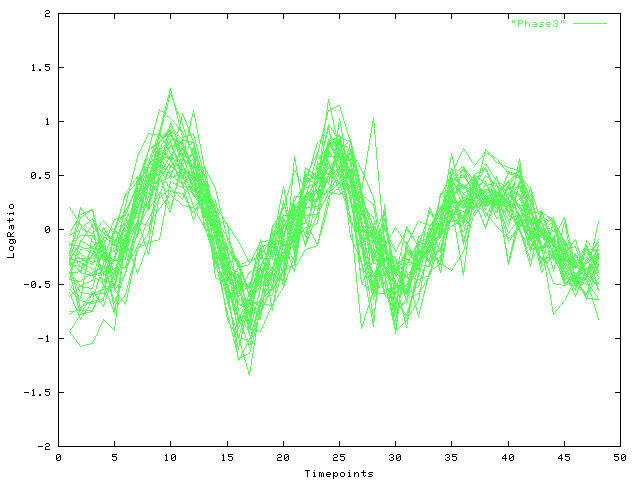 |
| Fig. 4 Log-ratio (y-axis) over time (x-axis): Viterbi decomposition of cluster (a), phase 3 |
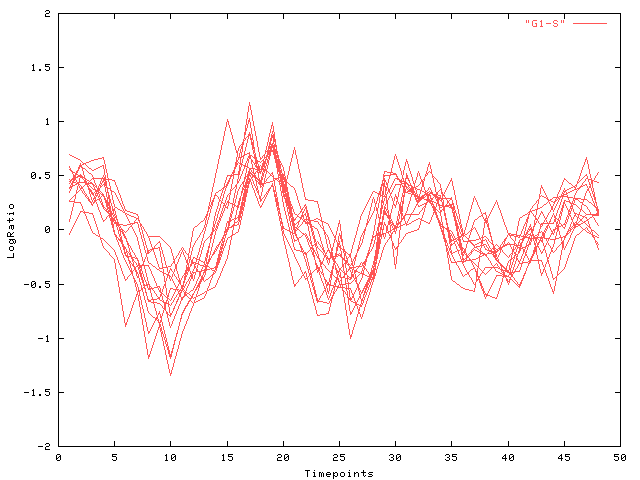 |
| Fig. 5 Log-ratio (y-axis) over time (x-axis): cluster (b) |
Partially Supervised Robustness
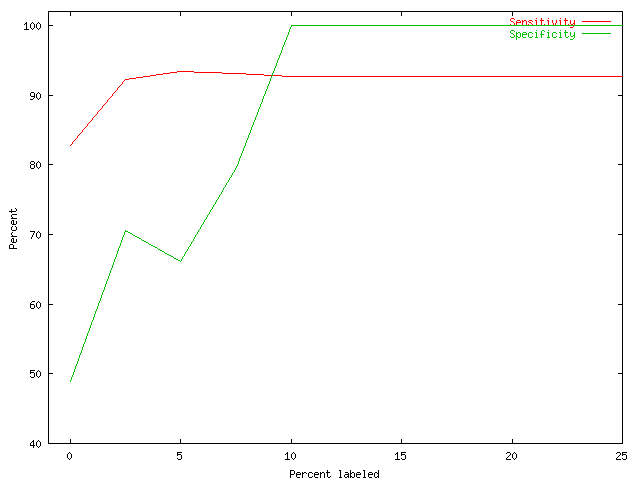 |
| Fig. 6 Sensitivity and Specificity of a partially supervised clustering procedure vs. percentage of labeled data |
In Fig. 6 we depict the clustering quality versus the proportion of data labeled in the input. Artificial data was generated from 8 multi-variate normal distributions with uniformly and randomly chosen mean vectors and identical covariance matrices proportional to the identity. A model-based clustering algorithm using Multivariate Gaussians with prescribed covariance matrices was modified for partially supervised learning. We ran 10 repetitions each for increasing amounts of labeled data covering at most half of the clusters. Specificity and sensitivity are used as measures of clustering quality.
Mixture Robustness
To compare the robustness of the model-based clustering using HMMs cluster models with the robustness of estimating a mixture of HMM components we performed the following experiment.
- We created eight HMMs encoding the possible three-segment regulation behaviors (e.g., down-down-down, up-down-down).
- Used Monte-Carlo algorithm to generate 20 sets of 200 time-courses each from the eight HMMs (32,000 artificial time-courses total)
- Noise was introduced by adding i.i.d. normally distributed variates with mean zero and variance sigma for various values of sigma.
- Both the clustering and the mixture method were run until convergence on the data sets and the mean values for the normal state emission PDFs of the resulting models were observed; the generating models were used as the initial model collection.
- The squared deviation of means between true and estimated models summed over all states of all models in the collection was computed.
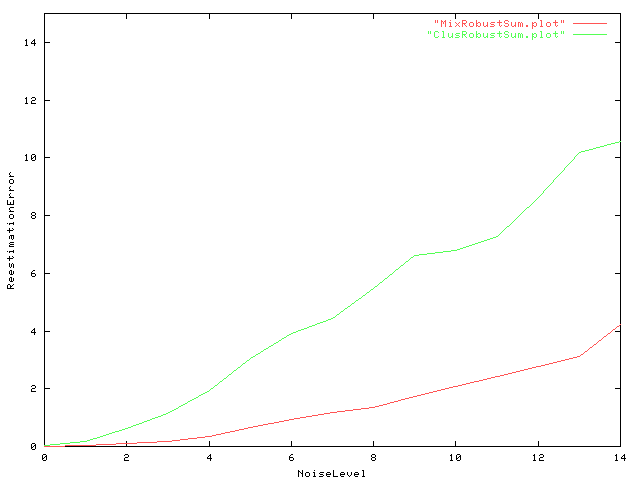 |
| Fig. 7 On the y-axis the squared estimation error summed up over all states and all models and averaged over the 20 samples is plotted against different levels of added noise ( N(0,sigma) , 0.1 < sigma < 1.5 in increments of 0.1). A Wilcoxon test comparing deviation of estimated model parameters from their true value showed significant lower estimation error for mixture clustering. |