MixDTrees: |
Tutorial
DTreeQuery
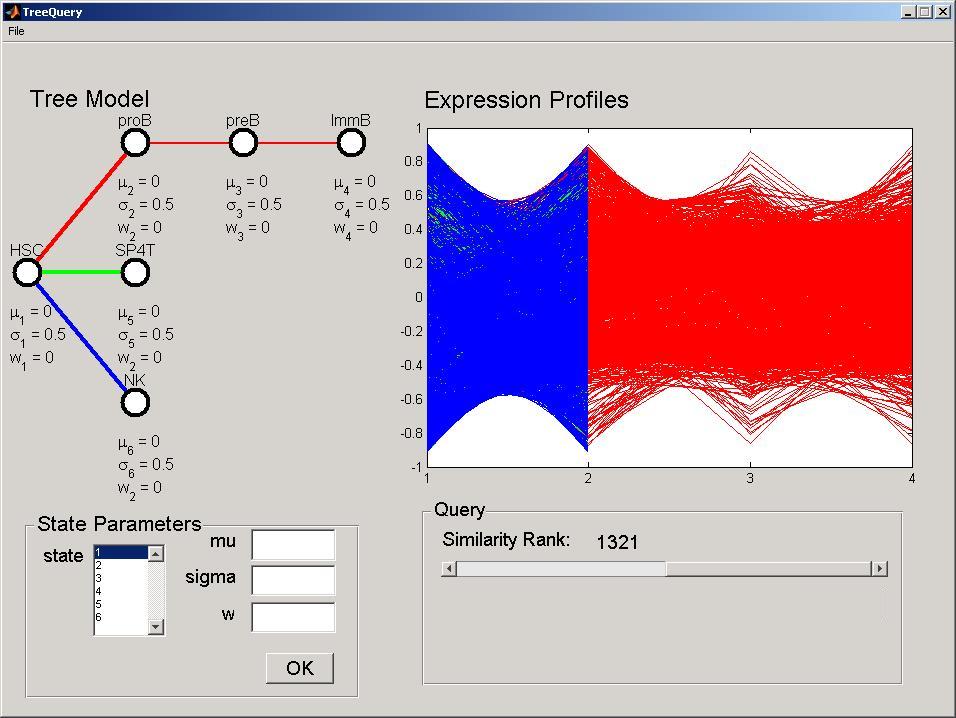
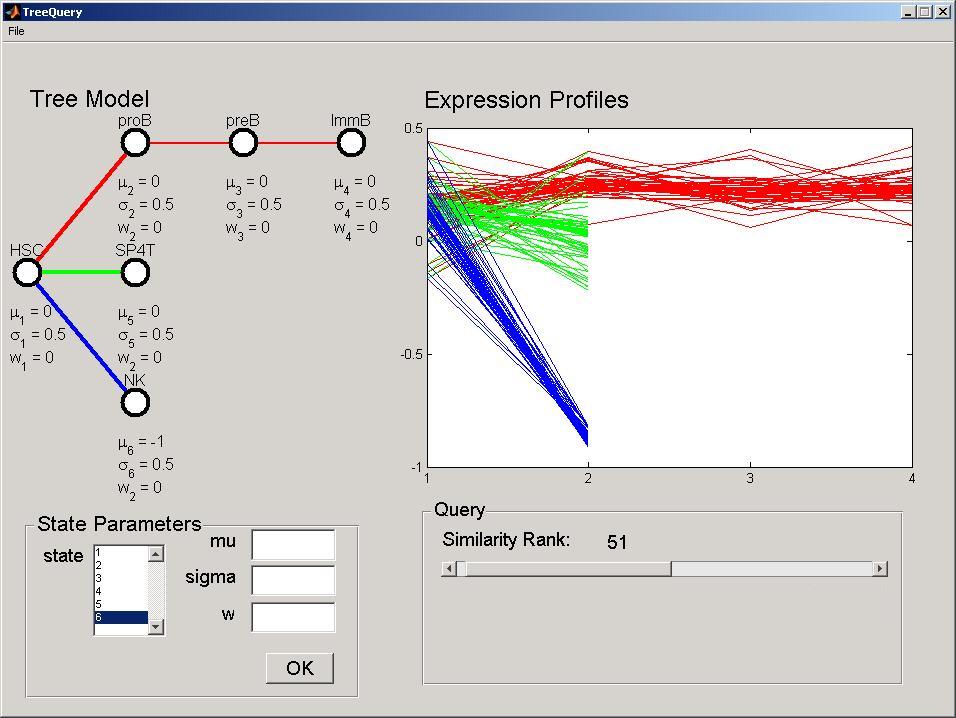
DTreeQuery is a graphical interface for querying development course data given a tree model. The interface is divided into four panels: the DTree panel in the top left, where you can see the current DTree Model, the State Parameters, where you can modify the DTree parameters, the Expression Profiles panel, where the developmental profiles of the current query are displayed, and the Query panel, where the user can define the query strigency.
Getting Started
Run DTreeQuery by double-clicking at the executable binary file in the bin folder inside your installation folder. In the file menu, select open tree and open the file data/tree_ltree.txt (all paths are relative to your installation folder). This DTree corresponds to the LympTree described in Documents. The Dtree topology will be displayed in the DTree panel, including the name of developmental stages above a node, and the stage parameters below it. The parameters are set with default values. In the file menu, select open data and open the file data/ltree.txt. All expression profiles in the data set will be displayed in the Expression Profiles panel. The color of the lines correspond to paths between developmental stages in the DTree depicted in the DTree panel. Note that for proper function, both data set and DTree topology need to have the same number of developmental stages(see File Format Section for file formats).
Perform a Query
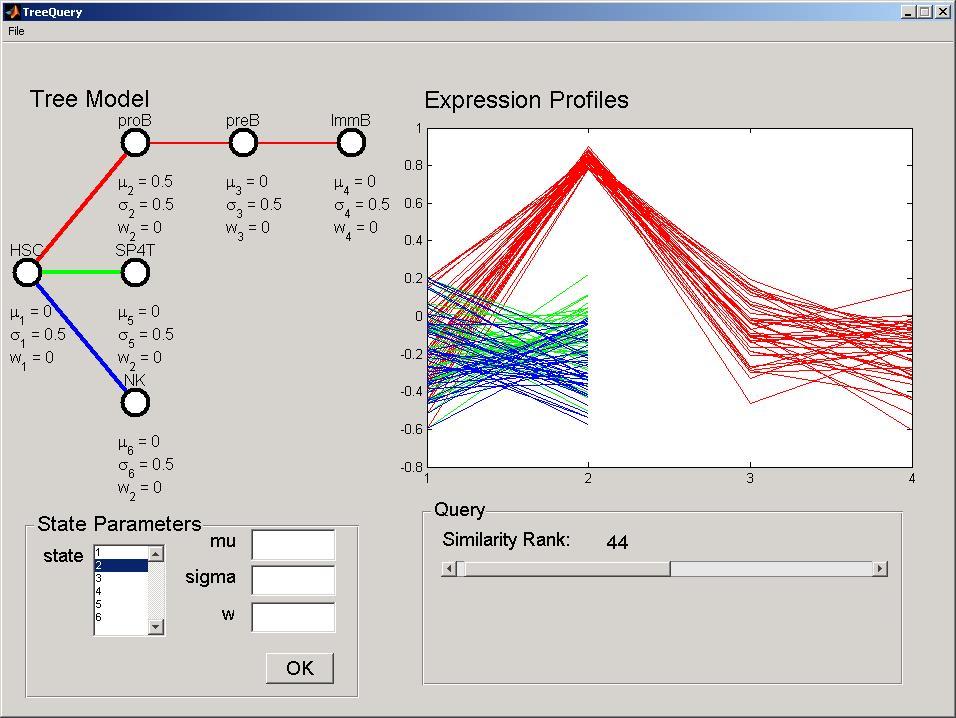
To modify a parameter of the DTree select the desired stage in the States listbox in the State Parameters panel. The current values will be displayed in the edit fields. Modify the parameters accordingly, and press the OK button to perform the modification and query the dataset. For example, select stage 2, set the mu parameter to 0.5 and press ok. This modification will be reflected in the DTree panel and the Expression Profiles panel will be updated. The mu parameter corresponds to the expected expression level, where positive values indicate over expression and negative values under expression. In this particular dataset, Stage 2 corresponds to pro B cells, thus, this model reflect genes over-expressed in pro-B cells (red branch), but not in the T cells (green branch) or NK Cells (blue branch).
To change the number of selected genes (query stringency), move the Similarity Rank slider in the Query panel. More formally, this selects the i more likely developmental profiles given the defined DTree. The Expression Profiles panel will be updated simultaneously displaying only the queried number of expression profiles. Selecting, for example, 44 genes, will result in the following screen being displayed.
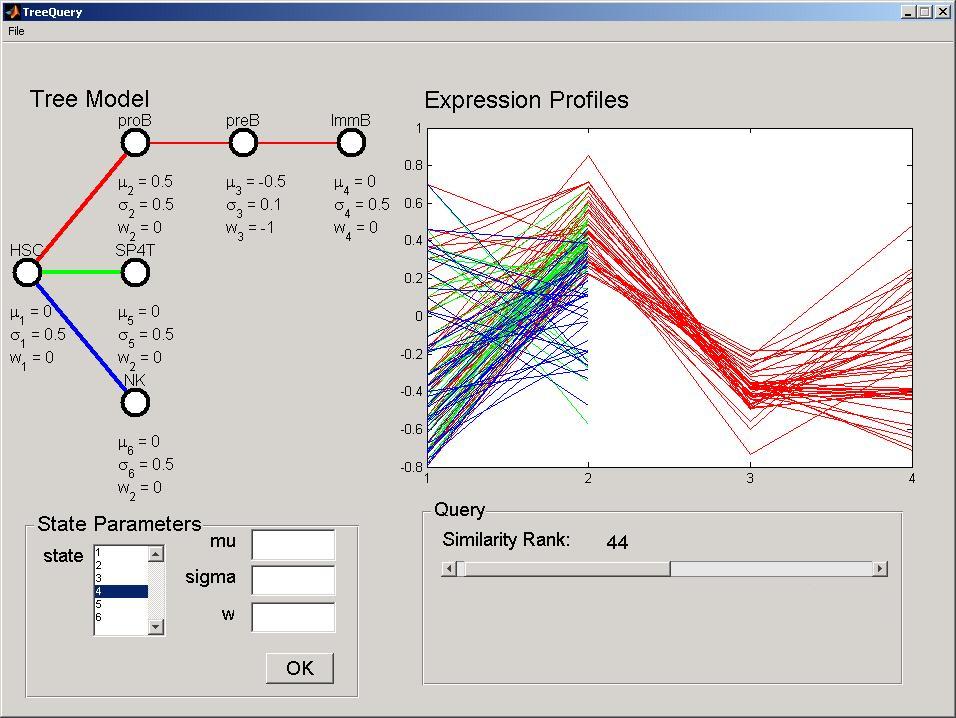
Changing the DTree parameters and the query stringency, the user is able to explore the gene expression data set for expression patterns of interest. The second parameter, the w, corresponds to the dependency between consecutive stages. For example, select stage 3, and set parameter w to -1 and the sigma to 0.01. Once you press the OK button, the expression profiles will be updated in the Expression Profiles panel. With this parameterization the model will look for genes ove-expressed in pro-B but under-expressed in pre-B, where genes highly expressed in pro-B are highly repressed in pre-B.
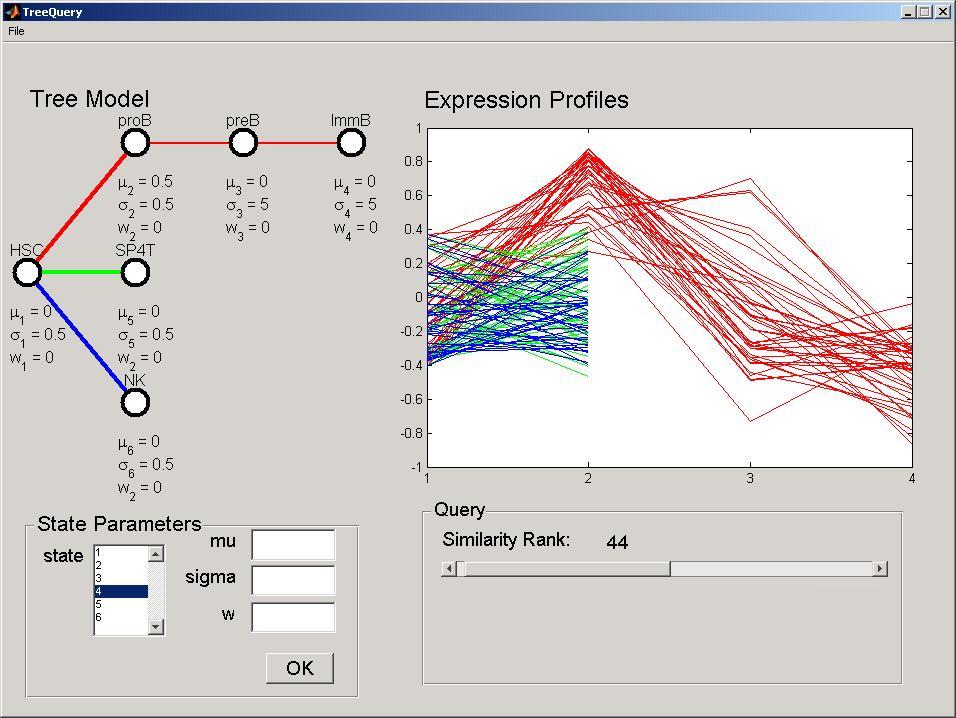
The third parameter, the sigma, indicates how much variance is allowed in one stage. For example, we can modify the first query for looking at genes over-expressed in pre-B, but disregard how these genes are expressed in pre-B and ImmB by specifying a high variance to these stages. Select stage 3, set w to zero and sigma to 5, and select stage 4, set sigma to 5.
As another example, we can now change the mu parameter of stage 6 to -1. Perform the query and select this time 50 genes. The tool will select genes under-expressed in NK cell, but not in other cells.
Saving Results
After your analysis is done, you can save the list of queried genes and plots. In the menu File, select Save Results, and define the file name and location. Save the results of the above query as 'first_query.txt'. They will be saved in a standard tab separated file, as well as jpg figures of the DTree and gene expression profiles. They can be further analyzed with the MixDTreesReport tool described below. The user can also save the DTree model and query for later analysis in the file menu, Save Query. Later any saved query can be opened with the file menu, Open Query. This automatically opens the data file, tree and its parameters.
MixDTrees
MixDTrees provides a simple graphical interface for performing mixture analysis in gene expression data in the course of development.
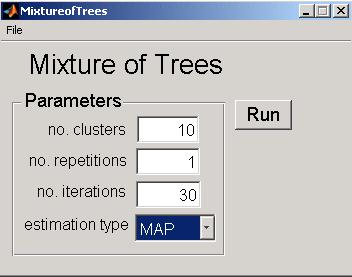
Run MixDTrees by double-clicking at the executable binary file or running it in matlab. In the file menu, select open tree and open the file data/tree_ltree.txt. To open the data set, select file menu, Open Data and open the file data/ltree.txt. If you want the tree topology to be estimated from the data, do not give any tree as input. In this casem the structure learning procedure described in Costa, 200 will be applied.
In the main panel, you can find the options for running the estimation. No. of Clusters represents the number of groups to be found in the data. No. of repetitions defines the number of times the estimation will be performed for avoiding effects of the tree model initialization. No. of iterations represents the number of iterations of the EM algorithm. Finally, the Estimation Type defines the type of estimates to be used (maximum likelihood estimate (MLE) or maximum a posteriori (MAP)). See Section 2 and 3 of the manuscript for parameters details.
For example, set no. of repetitions to 1 and no. of clusters as 20 and press the button Run. After some minutes, when estimation is successfully carried, the tool will display a Save Results dialog, where you can select a file name for saving results. Cluster plots are automatically saved in the same location as jpeg images. Again, these results can then be analysed with the MixDTreesReport.
Note that depending on the data size and parameter settings, the computations can take up to hours. In our computations, we used as default no. of repetitions of 15 and no. of iterations of 30.
Mixture of DTrees Report
MixDTreesReport is a tool for creating automatically a web database with expression profile plots, GO enrichment and microRNA enrichment analyses from a mixture or query result. All these pages are connected to other bioinformatics databases, so Internet connection is required.
Run MixDTreesReport by double-clicking at the executable binary file. Go to file menu, Open Results and indicate the file containing the results of a clustering or query. For example, select the file first_query.txt generated with the DTreeQuery tutorial. After a few minutes, the software will open a web browser with the results. If the browser does not open automatically, look at the folder were first_query.txt is saved and look for a file first_query_report.html. The same procedure can be performed with the mixture of DTrees result file.
A sample page, from the query on LTree, can be accessed here. The initial page contains plots of the gene expression profiles for each cluster, and its corresponding DTree model. The links in the header of the table leads you to the other analyses pages. Gene lists displays the names of all genes in that particular groups. The names are linked to the Entrez Gene database. The MicroRNA Enrichment link takes you to a summary page describing which microRNAs were enriched for a particular cluster. The microRNA is linked to the MIR Registry database and clusters numbers to the expression plots of the initial page. The table also lists all target genes of the enriched microRNAs for a particular cluster. The last link, GO Enrichment, displays a summary of Gene Ontology enrichment analysis using the tool GOStat. Visit GOStat for description of the GOStat results page.
Currently, this tool only support analysis data on Mus Musculus using MGI symbols as gene identifiers. Further support will be provided in future versions.
File formats:
Tree File
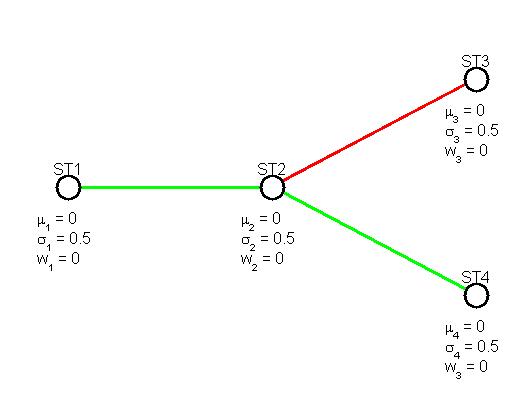
A DTree is described by a incidence matrix, where a 1 in position (i,j) indicates that stage j is a child of i. The incidence matrix is stored as a space separated file, where a 1 in row i column j means that stage j is child of stage i. Additionally, the user can specify the name of the stages by short names (not more then 5 chars) separated by a space in the first line of the file. Sample files of DTrees are provided in the e folder data of the software installation.
ST1 ST2 ST3 ST4
0 1 0 0
0 0 1 1
0 0 0 0
0 0 0 0
The above file corresponds to the following DTree.
Gene Expression File
All tools supports input files in standard tab separated files, as the ones used by most of gene expression analysis tools. In this format, each line represents a gene and the columns the measured time points. The first column holds the gene identifiers and the second column any type of annotation of the genes. Sample files of all formats are provided in the folder data of the software installation.
YHR124W  unknown                           -0.377685    -0.427071   -0.479749    0.175438
YGR072W  mRNA decay                        -0.067600    -0.664033   -0.412644    0.090134
YGR145W  unknown                            0.266238    -0.854138   -0.103595    0.371387
YIR031C  allantoin utilization             -0.017010     0.650807    0.461851   -0.146432
YMR172W  osmotic stress response           -0.734039    -0.258823   -0.135069    0.127290
YIR032C  ureidoglycolate hydrolase         -0.287924     0.701009    0.464117   -0.160077
YHR053C  metallothionein                   -0.263116     0.780098   -0.363840   -0.396216
Example of a gene expression file with four 4 development stages. The second column holds functional annotation of the genes.
MixtureofTrees/DTreeQuery Results file
Results are stored in a similar format as the one above. Cluster labels are stored as numbers in the second column, as expression values from the original data file are kept. For DTreeQuery tool, 1 indicates genes that met the query, 0 otherwise.
YHR124W  1         -0.377685    -0.427071   -0.479749    0.175438
YGR072W  3         -0.067600    -0.664033   -0.412644    0.090134
YGR145W  1          0.266238    -0.854138   -0.103595    0.371387
YIR031C  2         -0.017010     0.650807    0.461851   -0.146432
YMR172W  2         -0.734039    -0.258823   -0.135069    0.127290
YIR032C  3         -0.287924     0.701009    0.464117   -0.160077
YHR053C  3         -0.263116     0.780098   -0.363840   -0.396216